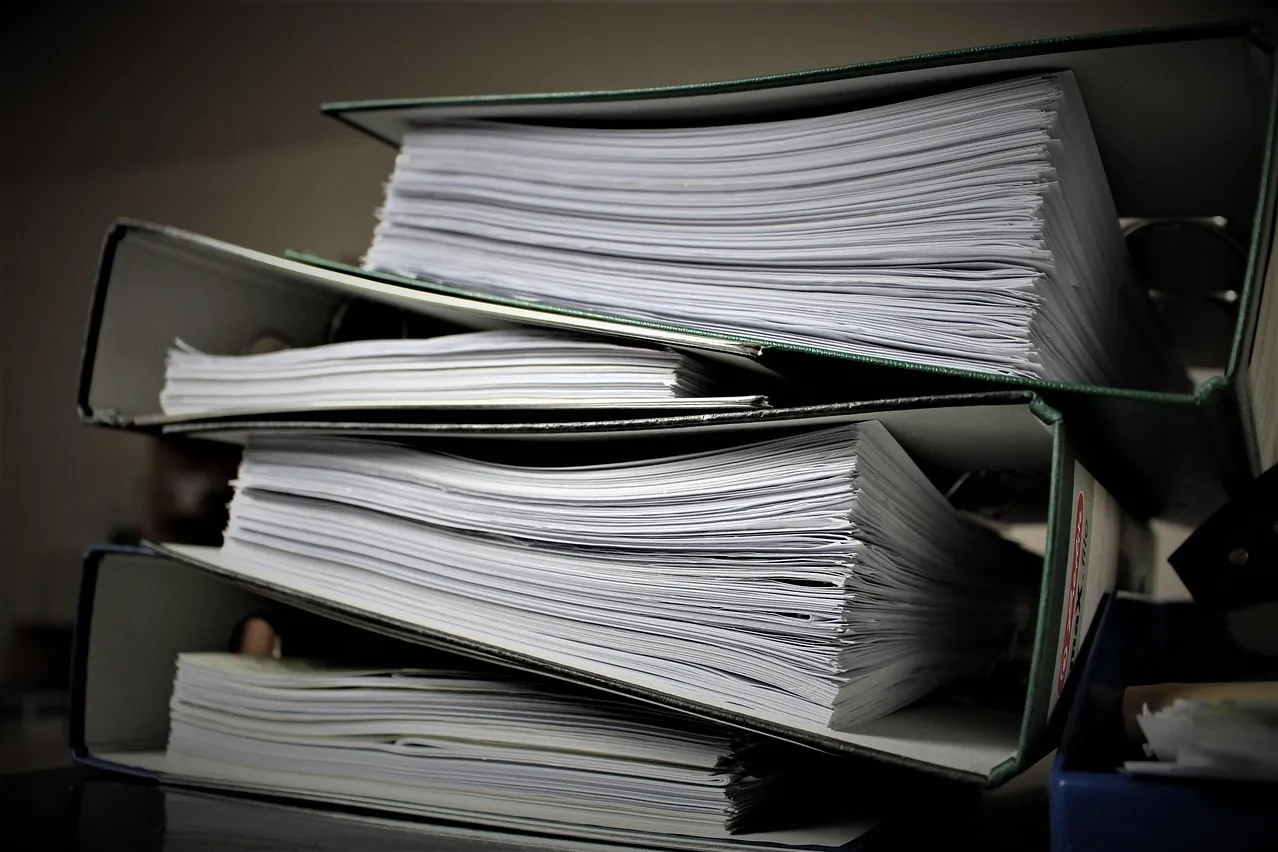
Delivered 8 Power BI projects with manuals
Delivered 8 Power BI projects with comprehensive manuals, integrating Microsoft Power BI tools with NodeJS API and Python FastAPI for effective data analytics and visualization.
Work carried out: 2022 – 2024

Photo: Pexels / Pixabay 
Photo: u_2kql2q3z8l / Pixabay
8 Power BI projects, each with its manual
Situation. The organization needed dynamic, visual insights into complex datasets involving electrical grid performance and geographical distribution metrics to support decision‑making across technical and strategic teams.
Task. Develop interactive dashboards and reporting solutions that could effectively present both real‑time and historical geographical and electrical data, enabling stakeholders to quickly identify trends, anomalies, and performance indicators.
Action. Integrated Microsoft Power BI with a custom backend stack using NodeJS API and Python FastAPI to streamline data ingestion, transformation, and visualization. Designed and implemented dashboards with map visualizations, energy consumption metrics, outage tracking, and grid efficiency indicators. Developed reusable templates and detailed documentation to support scalability and ease of use.
Result. Successfully delivered 8 data analytics projects, improving report generation efficiency by 60% and enabling cross‑functional teams to make faster, data‑driven decisions. Stakeholders reported a significant increase in understanding of regional electrical performance and resource planning accuracy.
Look back at Built the company's first observability dashboard. Read next: Released 500 electricity and GIS data reports. Or take a look at the full Portfolio.
One piece of a longer record — and it is all on this site.
Every entry is written the same way: the situation, the task, what we did and what changed.