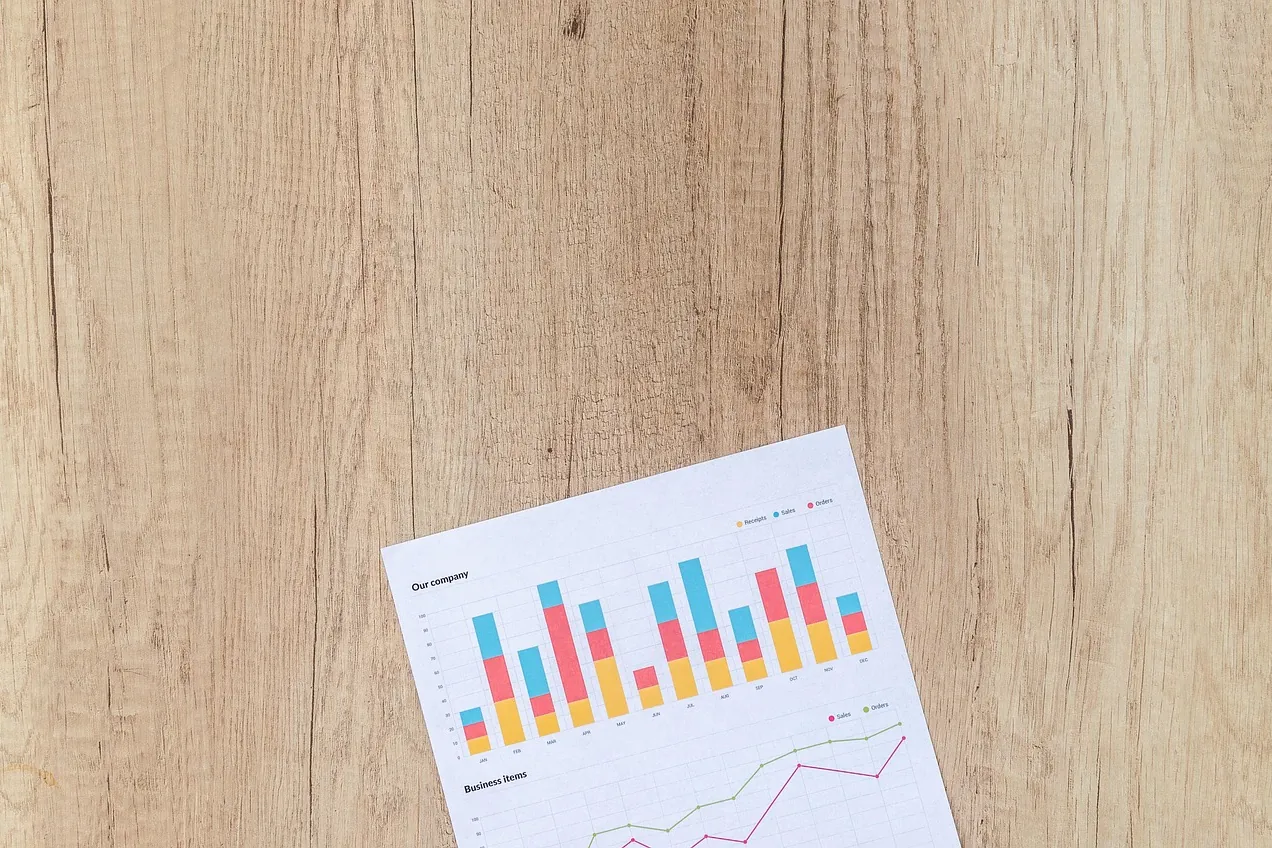
Developed a Data Analytics reporting system
Developed a Data Analytics reporting system, increasing quarterly software revenue by 400% through Python‑based PDF reports.
Work carried out: 2015 – 2022

Photo: cloudhoreca / Pixabay 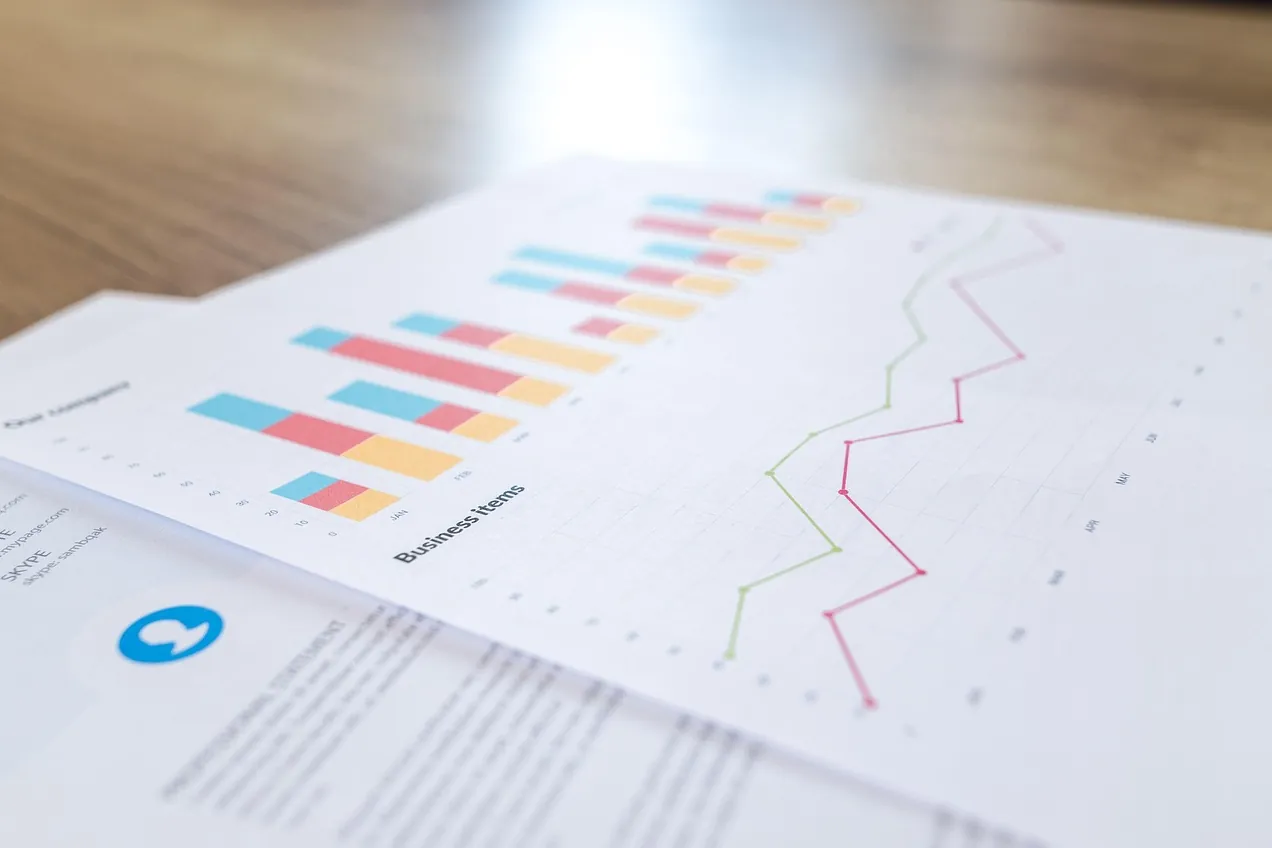
Photo: 6689062 / Pixabay
400% quarterly revenue, from one reporting system
Situation. Stakeholders weren’t getting analytics in any timely, readable form. The data existed, but turning it into something you could actually make a decision from was slow and manual, so visibility into how things were performing lagged, and the commercial decisions lagged with it.
Task. Building a data‑analytics reporting system — one that turned raw data into clear, regular insight without someone hand‑assembling it each time — was the job.
Action. A reporting system generated PDF reports in Python, automating the whole chain: pulling the data, running the analysis, and presenting it in a clean, consistent format stakeholders could actually read. The point was regularity and clarity — the same professional report landing predictably, so the numbers became something people looked at as a matter of course rather than something they had to go and dig for.
Result. That reporting is what drove quarterly software revenue up by 400%. Making the analytics better and faster wasn’t a back‑office nicety — put clear, timely numbers in front of the people making commercial decisions and the decisions get better, and here that showed up directly on the revenue.
Look back at Saved 4,000 hours with GitHub and GitLab CI/CD. Read next: Automated data processing in Python and PL/pgSQL. Or take a look at the full Portfolio.
One piece of a longer record — and it is all on this site.
Every entry is written the same way: the situation, the task, what we did and what changed.